The admin load on Australian health, care, legal and claims operators: the numbers in 2026
Case volumes in Australian health, disability, legal and claims work have grown far faster than the clerical workforce, and the qualified staff most likely to absorb the difference are the hardest to hire. The figures from more than 50 public sources in one place, with citations, primary-source screenshots and downloadable data.
Mitch Flindell · 28 September 2026 · 24 min read · Journal
Every operator we work with says some version of this: the work grows faster than the team. We wanted to know whether the public numbers agree. They point the same way, although no public series measures admin workload directly, and as far as we can tell nobody has put them side by side.
This report brings together the latest figures we could verify on 28 September 2026 from the NDIA, AIHW, ABS, Jobs and Skills Australia, the Productivity Commission, the ANAO, APRA, the RACGP and more than 30 other sources. Every figure carries a numbered citation to the source list at the end, the key passages are shown as screenshots of the original documents, and the data behind every chart and table can be downloaded as CSV. Where we have combined numbers ourselves, we label it Pragmatic AI analysis and show the method. Where a figure is thin or contested, we say so.
Key findings
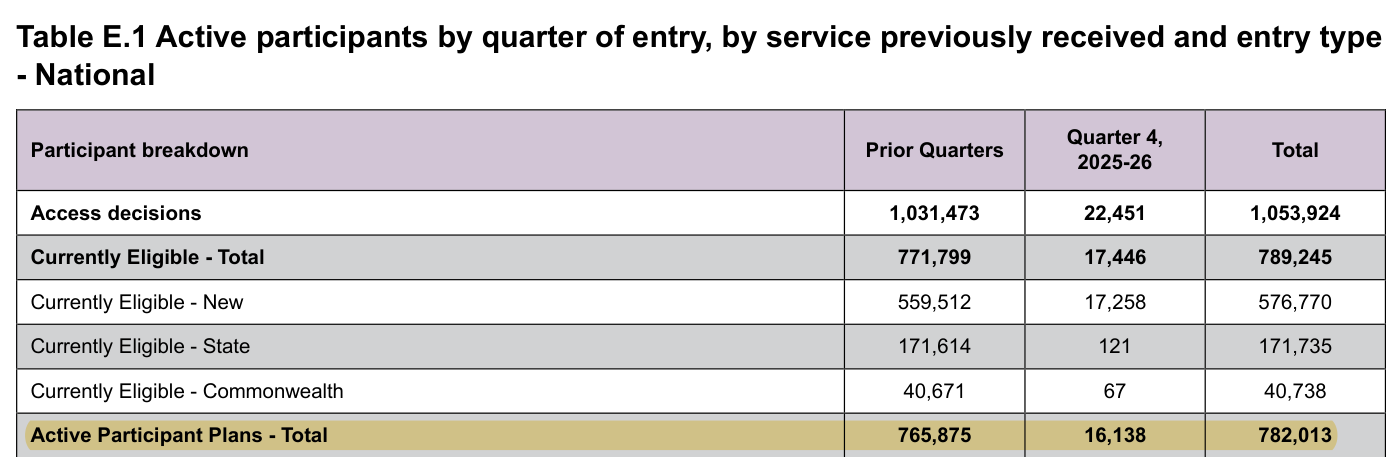
- ▪The NDIS had 782,013 active participants at 30 June 2026, 67.6% more than five years earlier124. It paid out $51.5 billion in 2025-26 on a cash basis1, and paid 142.7 million claims in calendar 2024, about 390,000 a day32.
- ▪Between February 2021 and February 2026, employment in health care and social assistance grew 34.1%, while clerical and administrative employment across the economy grew 8.3% (Pragmatic AI analysis of ABS Labour Force data)6061. These series do not measure admin workload directly.
- ▪Jobs and Skills Australia projects health care and social assistance jobs to grow 22.9% by 2035, but clerical and administrative jobs only 9.5%, with secretaries shrinking 5.7%14.
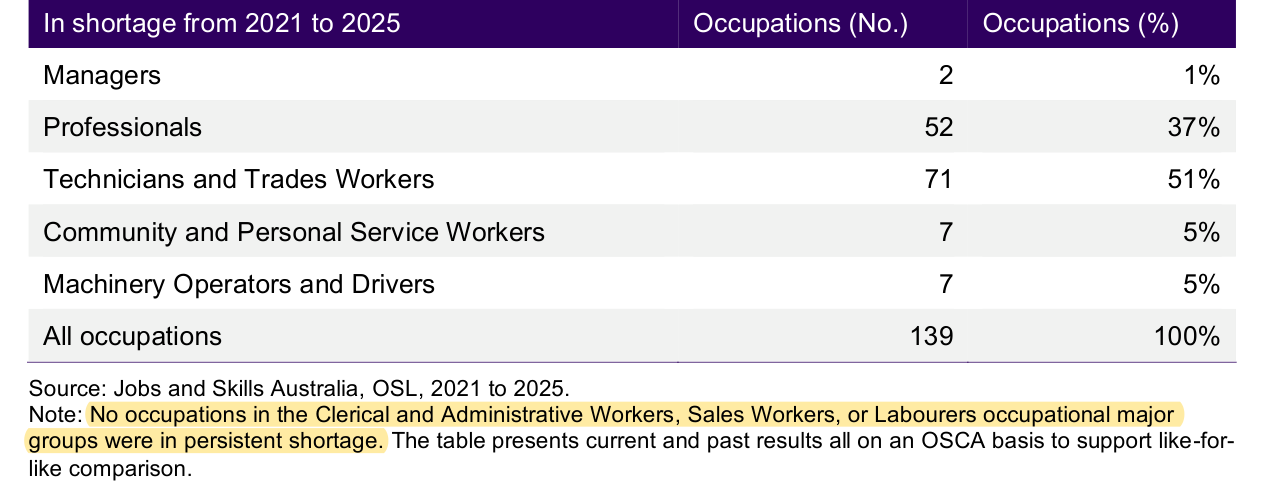
- ▪Only 2 of 71 clerical and administrative occupations are in national shortage, while GPs, registered nurses, disability support workers and solicitors are1819. Our reading is that the admin overflow tends to land on the people who are hardest to hire.
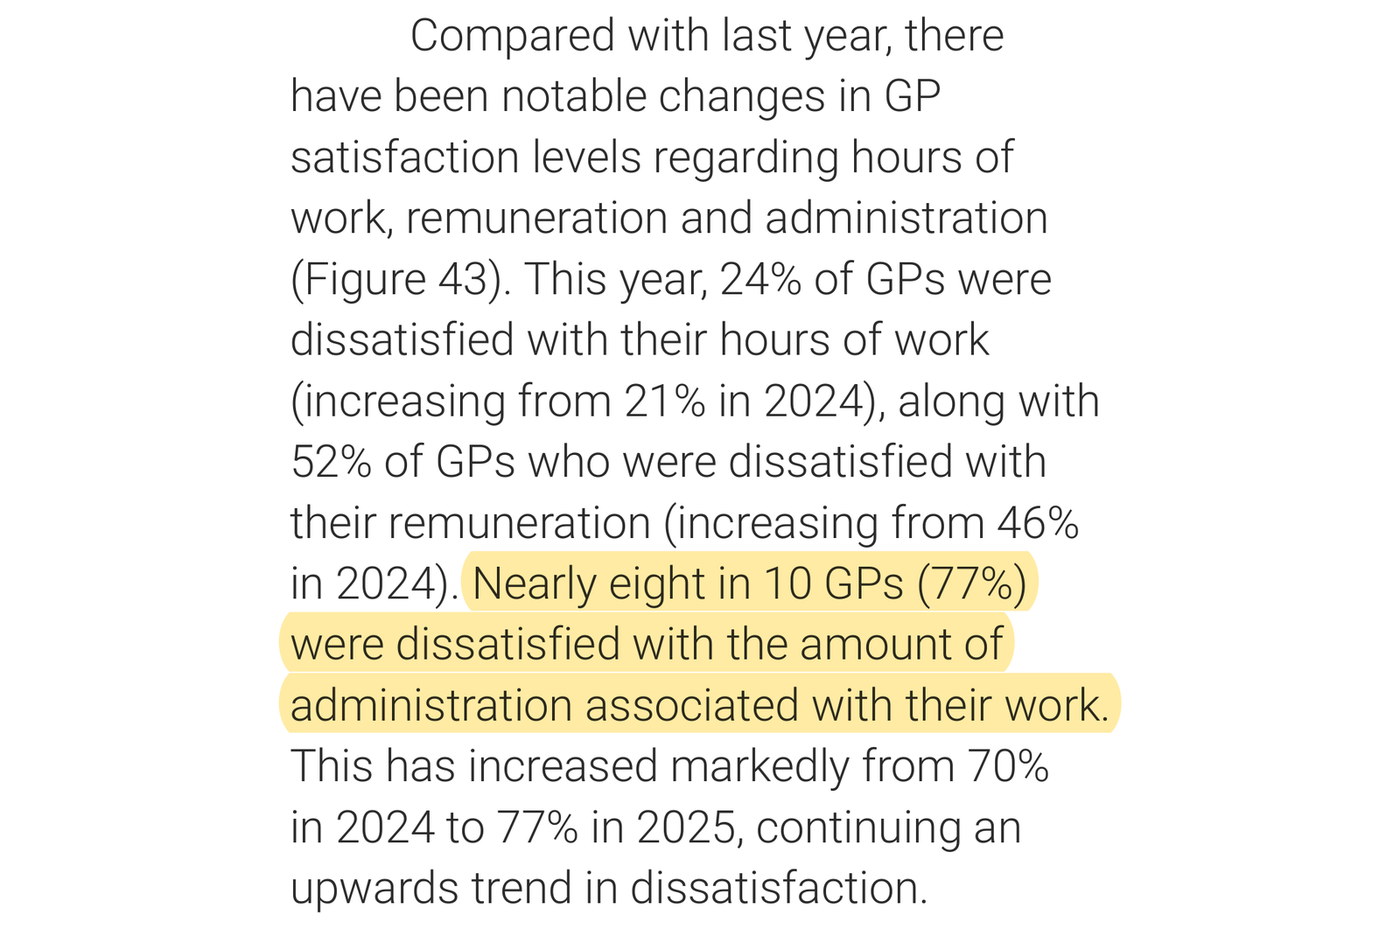
- ▪77% of GPs are dissatisfied with the amount of administration in their work, up from 58% in 202222.
- ▪44% of WA doctors in training reported spending three or more hours of an eight-hour shift on admin (Pragmatic AI analysis of the survey's own bands)23.
- ▪New NDIS appeals to the Administrative Review Tribunal rose 135% in two years, to 9,521 in 2025-26, while participants grew 18% (Pragmatic AI analysis)2551.
- ▪Targeted NDIA pre-payment reviews covered about 0.4% of outlay value and cancelled more than half of the value they reviewed32. For Medicare, $44.7 million in MBS debt was raised (not necessarily recovered) across 3,779 cases in 2024-2535; a 2023 review estimated MBS provider non-compliance at $1.5 billion to $3 billion a year34.
- ▪12% of Australian businesses used AI in 2024-25, and 17% in health care and social assistance38.
- ▪Published estimates of what AI could take on range from JSA's modelling assumption of 13% of tasks to McKinsey's 57% of US work hours in technical potential4750. None measures the routine share of Australian admin. On simple arithmetic, removing 13% of a team's human work gives it about 1.15 times its capacity, and removing half gives twice (Pragmatic AI analysis).
Case volumes grew by double digits while the admin workforce barely moved
The NDIS is the clearest case. The NDIA's June 2026 quarterly report to disability ministers counts 782,013 active participants with approved plans12, up from 466,619 at 30 June 20214. Total payments reached $51.5 billion in 2025-26 on a cash basis1, up 12.2% on the year before56 and 86% on 2021-2253: about $141 million a day. The claim count is closer to the admin load: the NDIA paid 142.7 million claims in calendar 2024, about 390,000 a day32, and 68.8% of participants have a plan manager handling their invoices3.
Health volumes grow more slowly, from a much larger base. The AIHW counts 12.8 million hospitalisations in 2024-25, up from about 11.8 million in 2020-21. 64% were same-day, rising to 75% in private hospitals5. The Department of Health, Disability and Ageing reports 482.5 million Medicare services in 2025-26 and $35.0 billion in benefits, or about 1.3 million services for every day of the year6. APRA's June 2026 figures show private health insurers paid for 1.35 million hospital episodes in the quarter, 3.1% more than a year earlier, with hospital benefits up 7.0%759.
Claims and legal work is growing unevenly. Safe Work Australia counts 146,700 serious workers' compensation claims in 2023-24, 34.5% more than a decade earlier8. State and territory civil lodgements have been flat at about 405,000 a year, but non-family-law lodgements in Division 2 of the Federal Circuit and Family Court, which include migration and other general federal matters, nearly doubled in two years, to 11,369 in 2024-259. The Administrative Review Tribunal received 85,845 lodgements in 2024-25, 71% more than the year before11.
Aged care is the newest pressure point. At 31 March 2026, 364,723 people were in the Support at Home ongoing services group, 338,049 of them receiving care and the rest assigned a place and still deciding, and another 100,191 were waiting in the priority system12.
| Measure | Earlier | Latest | Change |
|---|---|---|---|
| NDIS active participants41 | 466,619 (Jun 2021) | 782,013 (Jun 2026) | +67.6% |
| NDIS total payments, cash basis531 | $27.6b (2021-22) | $51.5b (2025-26) | +86.2% |
| Hospitalisations5 | about 11.8m (2020-21) | 12.8m (2024-25) | about +8% |
| Medicare services6 | 428.3m (2019-20) | 482.5m (2025-26) | +12.7% |
| Medicare benefits paid6 | $24.7b (2019-20) | $35.0b (2025-26) | +41.8% |
| Private health hospital episodes, June quarter597 | 1.31m (2025) | 1.35m (2026) | +3.1% |
| Serious workers' compensation claims8 | about 109,100 (2013-14) | 146,700 (2023-24) | +34.5% |
| State and territory civil lodgements9 | 403,972 (2019-20) | 404,652 (2024-25) | +0.2% |
| Federal Circuit and Family Court (Division 2) non-family-law lodgements9 | 5,845 (2022-23) | 11,369 (2024-25) | +94.5% |
| Administrative Review Tribunal lodgements11 | AAT (2023-24) | 85,845 (2024-25) | +71% |
| New NDIS appeals at the Tribunal2 | 4,044 (2023-24) | 9,521 (2025-26) | +135% |
ABS Labour Force data shows employment in health care and social assistance grew 34.1% between February 2021 and February 2026, to 2.39 million people. By our calculation the industry supplied about a third of all jobs growth in that time. Clerical and administrative employment across the whole economy grew 8.3%. Measured from February 2019, before the COVID dip, it grew only 3.3%6061. These are the February 2026 figures from the final Labour Force, Australia, Detailed release13, used as a fixed snapshot; later ABS revisions may differ slightly.
This is not a like-for-like comparison. Clerical workers serve every industry, not every new participant creates the same paperwork, and none of these series measures admin workload or who does it. But the direction is hard to miss: care volumes rose by double digits while the workforce that traditionally processes the paperwork barely grew.
The next decade widens the gap
Jobs and Skills Australia's projections to May 2035 expect health care and social assistance to add 541,900 jobs, a 22.9% increase and more than a quarter of all projected growth. Clerical and administrative workers are projected to grow 9.5%, below the 13.3% for all jobs. Receptionists grow 8.3% and accounting clerks 5.9%, while secretaries, the group that includes legal and medical secretaries, shrink by 5.7%14.
The hiring market is already moving that way. JSA's August 2026 Vacancy Report shows online job ads for clerical and administrative workers down 2.5% on a year earlier, the only major occupation group to fall15. Over the same period, ads for registered nurses rose 16.1%57.
Labour is also getting dearer. The ABS Wage Price Index rose 3.2% across all industries in the year to June 2026 and 3.8% in health care and social assistance, the highest of any industry16. The Fair Work Commission raised modern award minimum rates by 4.75% from the first full pay period starting on or after 1 July 2026, with additional adjustments for the lowest-paid classifications17.
Pragmatic AI analysis, on an assumption we cannot test from public data: if the sector's admin need tracks its employment, it grows about 23% by 2035 while the economy-wide admin workforce grows about 9.5%14. The difference will be absorbed one of two ways. Either qualified staff do more of the admin themselves, or more of the routine work stops needing a person.
The shortage is in the people the admin lands on
JSA's 2025 Occupation Shortage List rates 29% of assessed occupations in shortage (293 of 1,022)18. Among 71 clerical and administrative occupations, only two were in national shortage: clinical coders and conveyancers19. Medical receptionists, health practice managers, legal secretaries, insurance loss adjusters and accounts clerks were all rated not in shortage19, and JSA notes that no clerical occupation was in persistent shortage from 2021 to 202518.
The occupations that are short are the qualified ones. GPs, registered nurses in aged, acute and primary care, disability support workers and solicitors are all on the list, solicitors in every state and territory19. The Department of Health's nursing study projects an undersupply of 70,707 full-time-equivalent nurses by 2035, about 79,500 people20. Its GP modelling projects a gap of 7,700 GPs by 203321.
| Occupation | Kind of work | OSCA 2024 | ANZSCO 2022 | 2025 rating |
|---|---|---|---|---|
| Medical receptionist | Admin | 552131 | 542114 | Not in shortage |
| Health practice manager | Admin | 171331 | 512211 | Not in shortage |
| Legal secretary | Admin | 521235 | 521212 | Not in shortage |
| Law clerk | Admin | 521234 | 599214 | Not in shortage |
| Insurance loss adjuster | Admin | 531532 | 599612 | Not in shortage |
| Accounts clerk | Admin | 541131 | 551111 | Not in shortage |
| Clinical coder | Admin | 599931 | 599915 | Shortage |
| Conveyancer | Admin | 521131 | 599111 | Shortage |
| General practitioner | Clinical | 264231 | 253111 | Shortage |
| Registered nurse (aged care) | Clinical | 265433 | 254412 | Shortage |
| Occupational therapist | Clinical | 262331 | 252411 | Shortage |
| Disability support worker | Care | 422231 | part of 423111 | Shortage |
| Solicitor | Legal | 281331 | 271311 | Shortage |
This is the pattern we think matters most, and it is our inference, not something these sources measure. The shortage list says which occupations are short, not who does the paperwork. In our experience, operators are rarely stuck because they cannot hire an admin officer. The admin their admin team cannot absorb tends to end up with the nurse, the GP, the solicitor or the support coordinator, who are the hardest people in the country to hire. Every hour of routine case admin on their desk is an hour of scarce capacity gone, and each operator can measure how many hours that is.
Nobody measures clinicians' admin time nationally, but several surveys report the pressure
There is no current national measure of how much of an Australian clinician's week goes to administration. The most recent broad estimate, from the MABEL survey of doctors, put non-clinical work at just under 7 hours a week, or 16% of working time24. That was 2012 data, and it includes education as well as admin. What we have instead is a set of narrower surveys and studies, using different measures, that report administrative pressure.
The RACGP's Health of the Nation 2025 surveyed 2,416 GPs. 77% were dissatisfied with the amount of administration in their work, up from 58% in 2022, 60% in 2023 and 70% in 202422.
79% were dissatisfied with the time they spend on work Medicare does not fund. Asked which admin tasks they would change or remove, 44% named authority prescriptions22.
In hospitals, the AMA (WA) Hospital Health Check 2026 surveyed more than 1,300 doctors in training. Adding up the report's own bands, 44% reported spending three hours or more of an average 8-hour shift on administrative tasks23. The report's text gives 39% for 2 to 4 hours, but its chart bands for that range sum to 41%, so we use the bands.
In nursing and aged care, a time-and-motion study by Westbrook and colleagues (University of New South Wales and University of Technology Sydney) observed 57 nurses on two wards of one Sydney teaching hospital and found they spent 37.0% of their time with patients in the first observation period and 35.7% in the second25. The ANMF's August 2026 aged care survey found 46.6% of aged care workers rated the time they spend on paperwork as poor or very poor, rising to 50.9% of registered nurses26. That is a rating, not a count of hours. An observational study of community aged care case managers found documentation took a third of their office time, rising from 29.4% to 37.0% after the consumer-directed care reforms27.
Disability providers report the cost rather than the hours. National Disability Services' State of the Disability Sector Report 2025 surveyed 290 organisations: 48% ran a loss in 2024-25 and 81% of those delivering NDIS supports said they cannot keep doing so at current prices. Of 199 respondents to the question, 77% delivered unfunded services; the 149 that estimated the cost averaged more than $460,000 each. The report names NDIS administrative and regulatory issues among the causes28.
We found no Australian survey of lawyers' or claims staff's admin time. The nearest benchmark is Clio's 2025 US data: lawyers recorded 3.0 billable hours in an 8-hour day, or 38%29. The rest of the day is not all administration, and this is not an Australian sample. Overseas clinical studies are starker: a 2016 US study found doctors spent 27% of their office day with patients and 49.2% on records and desk work (Sinsky and colleagues)30, and a 2025 UK study of resident doctors found 43.4% of their time went on admin against 11.7% on direct patient contact31.
| Source | Who | Sample | Finding |
|---|---|---|---|
| RACGP Health of the Nation 202522 | GPs | 2,416 | 77% dissatisfied with the amount of admin |
| AMA (WA) Hospital Health Check 202623 | WA doctors in training | 1,300+ | 44% report 3+ hours of an 8-hour shift on admin |
| MABEL, 2012 data24 | Doctors | 8,581 | 16% of working time non-clinical |
| Westbrook and colleagues, 201125 | Hospital nurses, two wards | 57 | 37.0% of time with patients |
| ANMF Pulse Check 202626 | Aged care workers | 2,558 | 46.6% rate paperwork time poor or very poor |
| Prgomet and colleagues, 202027 | Community aged care case managers | 339 hours observed | Documentation 33.3% of office time |
| NDS State of the Disability Sector 202528 | Disability providers | 290 organisations (199 answered) | 77% delivered unfunded services |
| Clio Legal Trends 2025 (US)29 | Law firms | Clio users | 3.0 billable hours of 8 (not an admin measure) |
| Sinsky and colleagues, 2016 (US)30 | Physicians | 57 | 27% face time, 49.2% EHR and desk work |
| TACT, 2025 (UK)31 | Resident doctors | 137 sessions | 43.4% admin, 11.7% patient contact |
The backlog is where the admin shows up
The NDIA's own service guarantee figures show where the queue sits. Access has recovered: 96% of access decisions or requests for more information were made within 21 days in the June 2026 quarter, against 9% in the March 2025 quarter. But only 32% of participants who asked for a plan reassessment got a decision on whether it would go ahead within 21 days (86% of accepted reassessments were then completed within 28 days), 44% of plan amendments were made within 28 days and 48% of internal reviews were finished within 60 days2.
| Participant Service Guarantee | Target | Mar 2025 qtr | Jun 2026 qtr | On time, Jun 2026 qtr |
|---|---|---|---|---|
| Access decision, or request for more information | 21 days | 9% | 96% | 22,473 of 23,473 |
| Approve a plan after access | 56 days | 86% | 96% | 8,571 of 8,886 |
| Start a scheduled reassessment | 56 days before due | 64% | 45% | 4,284 of 9,558 |
| Decide whether to do a participant-requested reassessment | 21 days | 22% | 32% | 4,566 of 14,232 |
| Complete an accepted reassessment | 28 days | 84% | 86% | 28,165 of 32,815 |
| Amend a plan | 28 days | 39% | 44% | 12,976 of 29,309 |
| Complete an internal review | 60 days | 49% | 48% | 9,352 of 19,299 |
Appeals follow. By the NDIA's count, new NDIS cases at the Administrative Review Tribunal went from 4,044 in 2023-24 to 7,137 in 2024-25 and 9,521 in 2025-262.
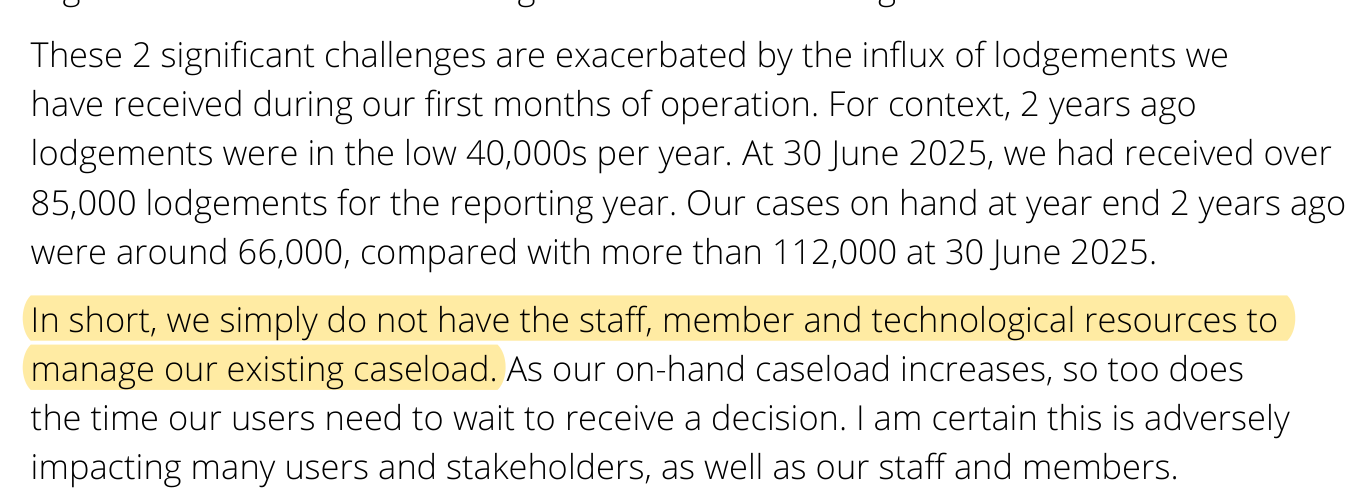
The Tribunal's 2024-25 annual report says 71% of NDIS matters it finalised were resolved by consent, meaning the parties agreed an outcome without a hearing. The Tribunal and the NDIA count NDIS applications differently, so we use the NDIA's count above. Across its whole caseload, in which migration and protection matters are the largest part, the Tribunal says plainly that it does not have "the staff, member and technological resources" to manage it11.
The pattern repeats elsewhere. In Division 2 of the Federal Circuit and Family Court, 11,598 of 20,508 pending non-family-law matters (56.6%) were more than 12 months old at 30 June 202563. Elapsed time is not necessarily court delay, but it is time a matter sits open. The median wait from approval to being assigned a home care package was 204 days in 2024-25, up from 78 days a year earlier10.
Not every backlog is admin. Tribunal queues depend on member numbers and elective surgery waits (a median of 45 days in 2024-25, with 6.0% of patients waiting more than a year)5 depend on theatres and surgeons. But many of the decisions in the NDIS queues involve reviewing documents: reading evidence, checking it against rules and writing it up.
Few claims are checked, and targeted reviews find substantial problems
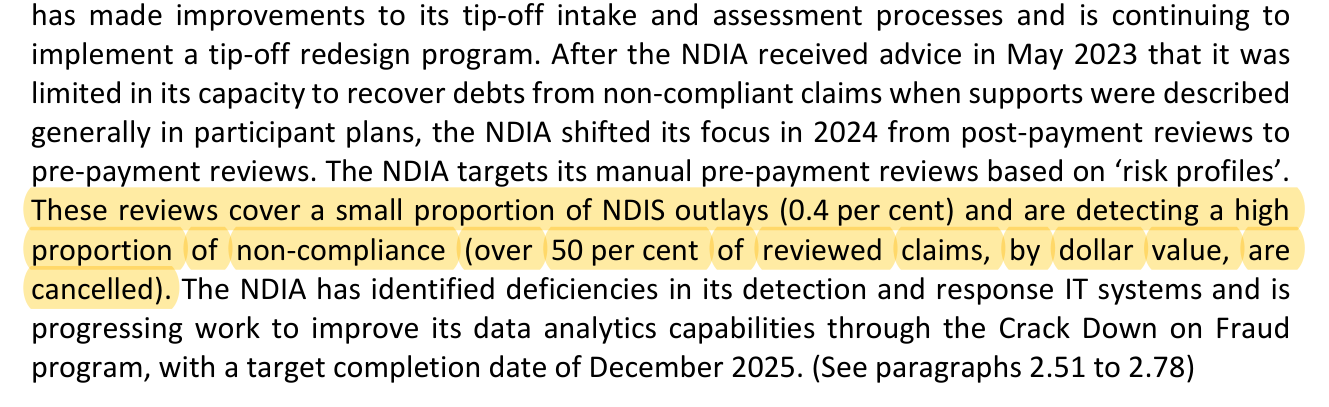
The ANAO's June 2025 audit of NDIS claim compliance reports an NDIA estimate that 6% to 10% of outlays could be non-compliant, fraudulent or incorrect: $2.0 billion to $3.5 billion in 2022-23. In 2024 the NDIA paid 142.7 million claims worth $42.9 billion, and reviewed 68,235 of them before payment. Those targeted manual reviews covered about 0.4% of outlay value in the latest quarters (0.3% across 2024), and more than half of the value they reviewed was cancelled. In a separate targeted analysis of $35 million of claims over $5,000, 41.2% of the claim value was rejected32. Because the reviews target risky claims, these are not failure rates for the scheme as a whole.
In May 2026, the NDIA told the parliamentary inquiry into NDIS integrity that it estimates broad "integrity leakage" at 8.2% to 8.3% of scheme payments, around $3.7 billion on about $45 billion a year6233. That covers administrative errors and payment mistakes as well as deliberate non-compliance and fraud; it is not a fraud estimate.
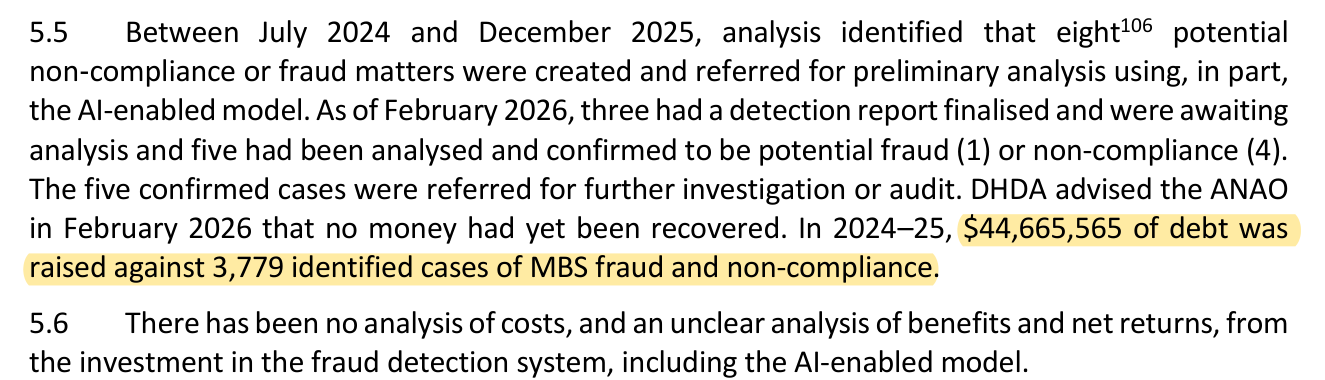
Medicare has the same shape. The 2023 Independent Review of Medicare Integrity and Compliance estimated provider non-compliance at $1.5 billion to $3 billion a year34, and the ANAO repeated that range in a September 2026 audit. The same audit reports $44.7 million in MBS debt raised in 2024-25 against 3,779 identified cases of fraud and non-compliance35. Debt raised is not money recovered, and the two figures have different bases, so they cannot be read as a recovery rate. But the gap in scale is plain. The widely reported $8 billion figure is contested: the review found it rests on a much broader definition, drawn from a small and unrepresentative billing sample, and only about $3 billion of it matches the department's definition34.
Errors run the other way too. By 30 June 2025, Bupa had paid $14.3 million on more than 4,100 claims where members were wrongly told they could claim nothing when part of their treatment was covered36, and on 11 December 2025 the Federal Court ordered it to pay $35 million in penalties58. Services Australia reports that 1.9% of its 466 million claim outcomes in 2024-25 contained a critical error, and about 6% of social security claims did37.
| Check | Finding | Period |
|---|---|---|
| NDIS outlays the NDIA estimates are non-compliant, fraudulent or incorrect32 | 6% to 10% ($2.0b to $3.5b) | 2022-23 |
| NDIS claims paid32 | 142.7m ($42.9b) | 2024 |
| NDIS outlay value covered by targeted pre-payment review32 | 0.3% (0.4% latest quarters) | 2024 |
| Reviewed NDIS claim value cancelled (targeted)32 | Over 50% | 2024 |
| NDIS claim value over $5,000 analysed and rejected (targeted)32 | 41.2% of $35m | 2022-23 |
| NDIS broad "integrity leakage"62 | 8.2% to 8.3% (about $3.7b) | 2024-25 |
| Estimated Medicare provider non-compliance3435 | $1.5b to $3b a year | 2023 estimate |
| MBS debt raised, not necessarily recovered35 | $44.7m on 3,779 cases | 2024-25 |
| Services Australia outcomes with a critical error37 | 1.9% of 466m | 2024-25 |
| Bupa claims wrongly rejected, remediation paid36 | $14.3m, 4,100+ claims | To 30 June 2025 |
For an operator, the lesson is not about fraud. Many of the problems these audits describe are ordinary: missing evidence, the wrong item, a claim outside the plan, a late lodgement. Some of those checks can be written down as rules; disputed evidence and exceptions need human judgement. People check only a sample because checking everything by hand is unaffordable. Software can apply the written rules to every case and send the doubtful ones to a person.
AI adoption is broad in surveys and shallow in practice
The ABS Characteristics of Australian Business survey found 12% of businesses used AI in 2024-25, up from 1% in 2021-22. The figure was 35% for large businesses and 17% in health care and social assistance. The ABS notes the question does not measure how intensively AI is used38.
The National AI Centre's adoption tracker, which asks SMEs to describe their stage of adoption, puts the figure at 43% for December 2025 to February 2026, with health among the sectors above half. Among businesses not adopting, about 65% cited distrust of AI decision-making or a preference to keep human control39. That concern is reasonable, and it is a design requirement, not an obstacle.
In clinical work, The Medical Republic reported that 18.7% of 1,535 GPs in a May 2026 Healthed survey said they personally use an AI scribe40; we could not check the survey's method. A self-selected RACGP newsGP poll put use in respondents' practices at 40%41, which measures something different. Among respondents to the 2025 Victorian Lawyer Census, 36.7% reported using AI tools, and 64.8% of those relied on general-purpose chat tools42. The best trial evidence on scribes is modest: in a 238-doctor randomised trial published in NEJM AI in 2025, one scribe cut time spent on notes by 9.5% and the other made no significant difference43.
The rules are clear enough to work within. The OAIC's guidance says privacy obligations apply to what goes into an AI system and what comes out, and recommends against entering personal information into publicly available generative AI tools44. Ahpra says practitioners remain responsible for care and must apply human judgement to AI output45. The December 2025 National AI Plan relies on existing, technology-neutral law and regulators, rather than proceeding with the 2024 proposal for mandatory guardrails46.
The adoption surveys do not measure how many complete cases AI handles. Our view from practice is that most use is still individuals using general tools on single tasks. That helps at the margin but rarely changes how many cases a team can finish, because a person still has to check and complete each case.
Estimates of what AI could take on vary widely, and none measures your admin
| Source | Scope | Estimate | Caveat |
|---|---|---|---|
| Jobs and Skills Australia, Our Gen AI Transition (2025)47 | Australian workforce | 13% of tasks automated, about 55% augmented | A model assumption. 4% of workers are in highly exposed occupations, 79% in low |
| Productivity Commission, Harnessing data and digital technology (2025)48 | Australian economy | Modelled AI adoption across 14% of tasks | A model: 20% of tasks exposed, 70% of those assumed profitable to adopt |
| OECD (2020)49 | Australian jobs | 36% at risk, 11% at high risk | Predates generative AI |
| McKinsey Global Institute (2025)50 | US work hours | About 57% technically automatable | Technical potential, not a forecast |
| McKinsey & Company (2023)51 | Employees' time, global | 60% to 70% | Technical potential |
| Sahni, Carrus and Cutler, JAMA (2021)52 | US health administration spending | About 28% could be saved | US admin is about a quarter of health spending; does not transfer directly |
JSA finds automation potential is concentrated in routine clerical and administrative roles47. The Productivity Commission expects multifactor productivity gains above 2.3% over a decade, worth about $116 billion of GDP over those ten years48. McKinsey names legal and administrative services among the most exposed roles and is explicit that its figure is technical potential, not a forecast50.
The honest reading is that the two Australian government models assume AI takes on a modest share of tasks across the whole economy, and that routine clerical work sits near the top of the exposure rankings. Neither tells an operator what share of their own cases could be finished without a person. That share can be far above or below any national figure, and it has to be measured on real cases, not assumed from a national study.
For a typical operator, the gain depends on how much human work actually goes
A team's capacity follows the share of its human work that is removed. On paper it does not matter how that happens: removing 13% of the work in every case frees the same time as finishing 13% of equal-effort cases with no one touching them.
Our method: capacity = 1 ÷ (1 − the share of human work removed). It assumes the remaining work takes the same effort and nothing else becomes the bottleneck. Remove 13% of the work, the figure JSA assumes for tasks in its economy-wide model47, and a team has about 1.15 times its capacity. Remove half and it doubles.
An illustrative example: a team at full stretch handling 1,000 cases a week. If 13% of its work goes, for example because 130 of those cases finish without anyone touching them, the same team can take on about 1,150 a week. If half its work goes, it can take on about 2,000. These are round numbers to show the arithmetic, not a forecast.
In practice, and this is our view from our own work rather than a measured result, step-level help often removes less work than it appears to. A person still opens, reads, checks, hands off and closes every case, so saving a few minutes inside each one leaves most of the handling in place. A case that finishes untouched removes all of it. That is why we count whole cases.
We also think, and again it is a view rather than a statistic, that well-defined case types in these sectors carry more rule-based work than economy-wide models assume. The admin GPs most want removed is authority prescriptions and government and insurance forms22. NDIS claims are cancelled for not meeting written claim requirements32. Medicare non-compliance is, by definition, billing that breaks the rules34. Invoices checked against a plan are exactly this kind of work. That is why we measure the untouched share on each operator's own cases before promising anything, and why the cases that need judgement stay with their staff.
How we built this report
- ▪Every figure comes from a public source available on 28 September 2026. We identify the release and period used for each series, and each figure carries a numbered citation to the source list below.
- ▪Figures labelled Pragmatic AI analysis are simple arithmetic on published numbers, and the method is stated beside each one and in the notes column of the CSV files.
- ▪Series are not always aligned: NDIS counts are at 30 June, ABS employment at February. Health care employment is seasonally adjusted, and clerical employment is original data because that is how the ABS publishes it. The ABS ceased Labour Force, Australia, Detailed after its March 2026 release, so we use its February 2026 workbooks as a fixed snapshot; later revisions may differ slightly.
- ▪The screenshots are crops of the original documents with the quoted passage highlighted. Each links to the document it came from.
- ▪We left out figures we could not trace to a primary source, including the claim that GPs spend up to nine hours a week on red tape (a 2013 AMA item with no published method) and the claim that lawyers spend 48% of their time on admin.
Each row gives the metric, value, unit, period, geography, source title, source URL and notes. Derived rows are marked DERIVED with their method. The data is free to reuse under CC BY 4.0 with a link to this page. We plan to update these numbers each year.
If you run one of these operations and want to know what share of your own cases is routine, start with a free conversation about how your cases arrive today.
Sources
- 1Quarterly report to disability ministers, Q4 2025-26 (National Dashboard transcript) · National Disability Insurance Agency, 2026
- 2NDIS Quarterly Report, Supplement E: National, June 2026 · National Disability Insurance Agency, 2026
- 3Plan management types data, June 2026 · National Disability Insurance Agency, 2026
- 4Quarterly report to disability ministers, 30 June 2021 · National Disability Insurance Agency, 2021
- 5Hospitals at a glance · Australian Institute of Health and Welfare, 2026
- 6Medicare annual statistics: state and territory, 2009-10 to 2025-26 · Department of Health, Disability and Ageing, 2026
- 7Quarterly private health insurance membership and benefits summary, June 2026 · Australian Prudential Regulation Authority, 2026
- 8Key Work Health and Safety Statistics Australia 2025 · Safe Work Australia, 2025
- 9Report on Government Services 2026, Part C, Section 7: Courts · Productivity Commission, 2026
- 10Report on Government Services 2026, Part F, Section 14: Aged care services · Productivity Commission, 2026
- 11Annual Report 2024-25 · Administrative Review Tribunal, 2025
- 12Support at Home Program data report, 1 January to 31 March 2026 · Department of Health, Disability and Ageing, 2026
- 13Labour Force, Australia, Detailed, March 2026 (final release; February 2026 data) · Australian Bureau of Statistics, 2026
- 14Employment Projections, May 2025 to May 2035 · Jobs and Skills Australia, 2025
- 15Vacancy Report, August 2026 · Jobs and Skills Australia, 2026
- 16Wage Price Index, Australia, June 2026 · Australian Bureau of Statistics, 2026
- 17Annual Wage Review 2026: announcement of decision · Fair Work Commission, 2026
- 182025 Occupation Shortage List: key findings report · Jobs and Skills Australia, 2025
- 192025 Occupation Shortage List: 6 digit ANZSCO and OSCA · Jobs and Skills Australia, 2025
- 20Nursing Supply and Demand Study 2023-2035 · Department of Health and Aged Care, 2024
- 21Building the General Practice Workforce to Strengthen Medicare: impact analysis · Department of Health and Aged Care, 2025
- 22General Practice: Health of the Nation 2025 · Royal Australian College of General Practitioners, 2025
- 23Hospital Health Check 2026: full report · Australian Medical Association (WA), 2026
- 24Australian doctors' non-clinical activities: results from the MABEL survey of doctors (Australian Health Review) · Joyce, Eyre, Wang and Laurence, 2015
- 25How much time do nurses have for patients? (BMC Health Services Research) · Westbrook, Duffield, Li and Creswick, 2011
- 26Pulse Check of the Aged Care Sector: The Real Impact of Reforms · Australian Nursing and Midwifery Federation, 2026
- 27Understanding the work of case managers in Australian community aged care (Australian Health Review) · Prgomet, Walter, Jorgensen, Georgiou and Westbrook, 2020
- 28State of the Disability Sector Report 2025 · National Disability Services, 2025
- 29Legal Trends benchmarks 2025 · Clio, 2025
- 30Allocation of physician time in ambulatory practice (Annals of Internal Medicine) · Sinsky and colleagues, 2016
- 31Time Allocation in Clinical Training (TACT) (QJM) · Arab and colleagues, 2025
- 32NDIA's management of claimant compliance with NDIS claim requirements (Auditor-General Report No. 48 2024-25) · Australian National Audit Office, 2025
- 33Billions of NDIS funds lost to 'integrity leakage' last year, executive tells parliamentary hearing · ABC News, 2026
- 34Independent Review of Medicare Integrity and Compliance: final report · Department of Health and Aged Care, 2023
- 35Artificial Intelligence and Medicare Benefits Integrity (Auditor-General Report No. 5 2026-27) · Australian National Audit Office, 2026
- 36Private Health Insurance Report to the Australian Senate, 2024-25 · Australian Competition and Consumer Commission, 2025
- 37Annual Report 2024-25 · Services Australia, 2025
- 38Characteristics of Australian Business, 2024-25 · Australian Bureau of Statistics, 2026
- 39AI adoption insights: December 2025 to February 2026 · National AI Centre, Department of Industry, Science and Resources, 2026
- 40How many GPs are actually using AI scribes? · The Medical Republic, 2026
- 41GPs' AI scribe use doubles in one year: poll · RACGP newsGP, 2025
- 42Generative AI use in the legal profession: findings from the 2025 Victorian Lawyer Census · Victorian Legal Services Board and Commissioner, 2026
- 43Ambient AI scribes in clinical practice: a randomized trial (NEJM AI) · Lukac and colleagues, 2025
- 44Guidance on privacy and the use of commercially available AI products · Office of the Australian Information Commissioner, 2024
- 45Meeting your professional obligations when using artificial intelligence in healthcare · Ahpra, 2024
- 46National AI Plan · Department of Industry, Science and Resources, 2025
- 47Our Gen AI Transition: implications for work and skills · Jobs and Skills Australia, 2025
- 48Harnessing data and digital technology: inquiry report no. 111 · Productivity Commission, 2025
- 49Preparing for the future of work across Australia · OECD, 2020
- 50Agents, robots, and us: skill partnerships in the age of AI · McKinsey Global Institute, 2025
- 51The economic potential of generative AI: the next productivity frontier · McKinsey & Company, 2023
- 52Administrative simplification and the potential for saving a quarter-trillion dollars in health care (JAMA) · Sahni, Carrus and Cutler, 2021
- 53Quarterly report to disability ministers, 30 June 2022 · National Disability Insurance Agency, 2022
- 54Quarterly report to disability ministers, 30 June 2023 · National Disability Insurance Agency, 2023
- 55Quarterly report to disability ministers, 30 June 2024 · National Disability Insurance Agency, 2024
- 56Quarterly report to disability ministers, 30 June 2025 · National Disability Insurance Agency, 2025
- 57Internet Vacancies, ANZSCO4 occupations, states and territories, August 2026 · Jobs and Skills Australia, 2026
- 58Bupa ordered to pay $35 million for unconscionable conduct and making misleading representations about members' health insurance entitlements · Australian Competition and Consumer Commission, 2025
- 59Quarterly private health insurance membership and benefits summary, June 2025 · Australian Prudential Regulation Authority, 2025
- 60Labour Force, Australia, Detailed, Table 04: employed persons by industry (workbook, March 2026 release) · Australian Bureau of Statistics, 2026
- 61Labour Force, Australia, Detailed, Table 07: employed persons by occupation (workbook, March 2026 release) · Australian Bureau of Statistics, 2026
- 62Integrity of the National Disability Insurance Scheme, Chapter 1: Introduction and background · Joint Standing Committee on the National Disability Insurance Scheme, Parliament of Australia, 2026
- 63Report on Government Services 2026, Part C, Section 7: Courts, data tables (Table 7A.21, backlog indicator, civil) · Productivity Commission, 2026